I have finished the temperature blanket panel for 2025!
Uncategorized
2
Posts
2
Posters
2
Views
-
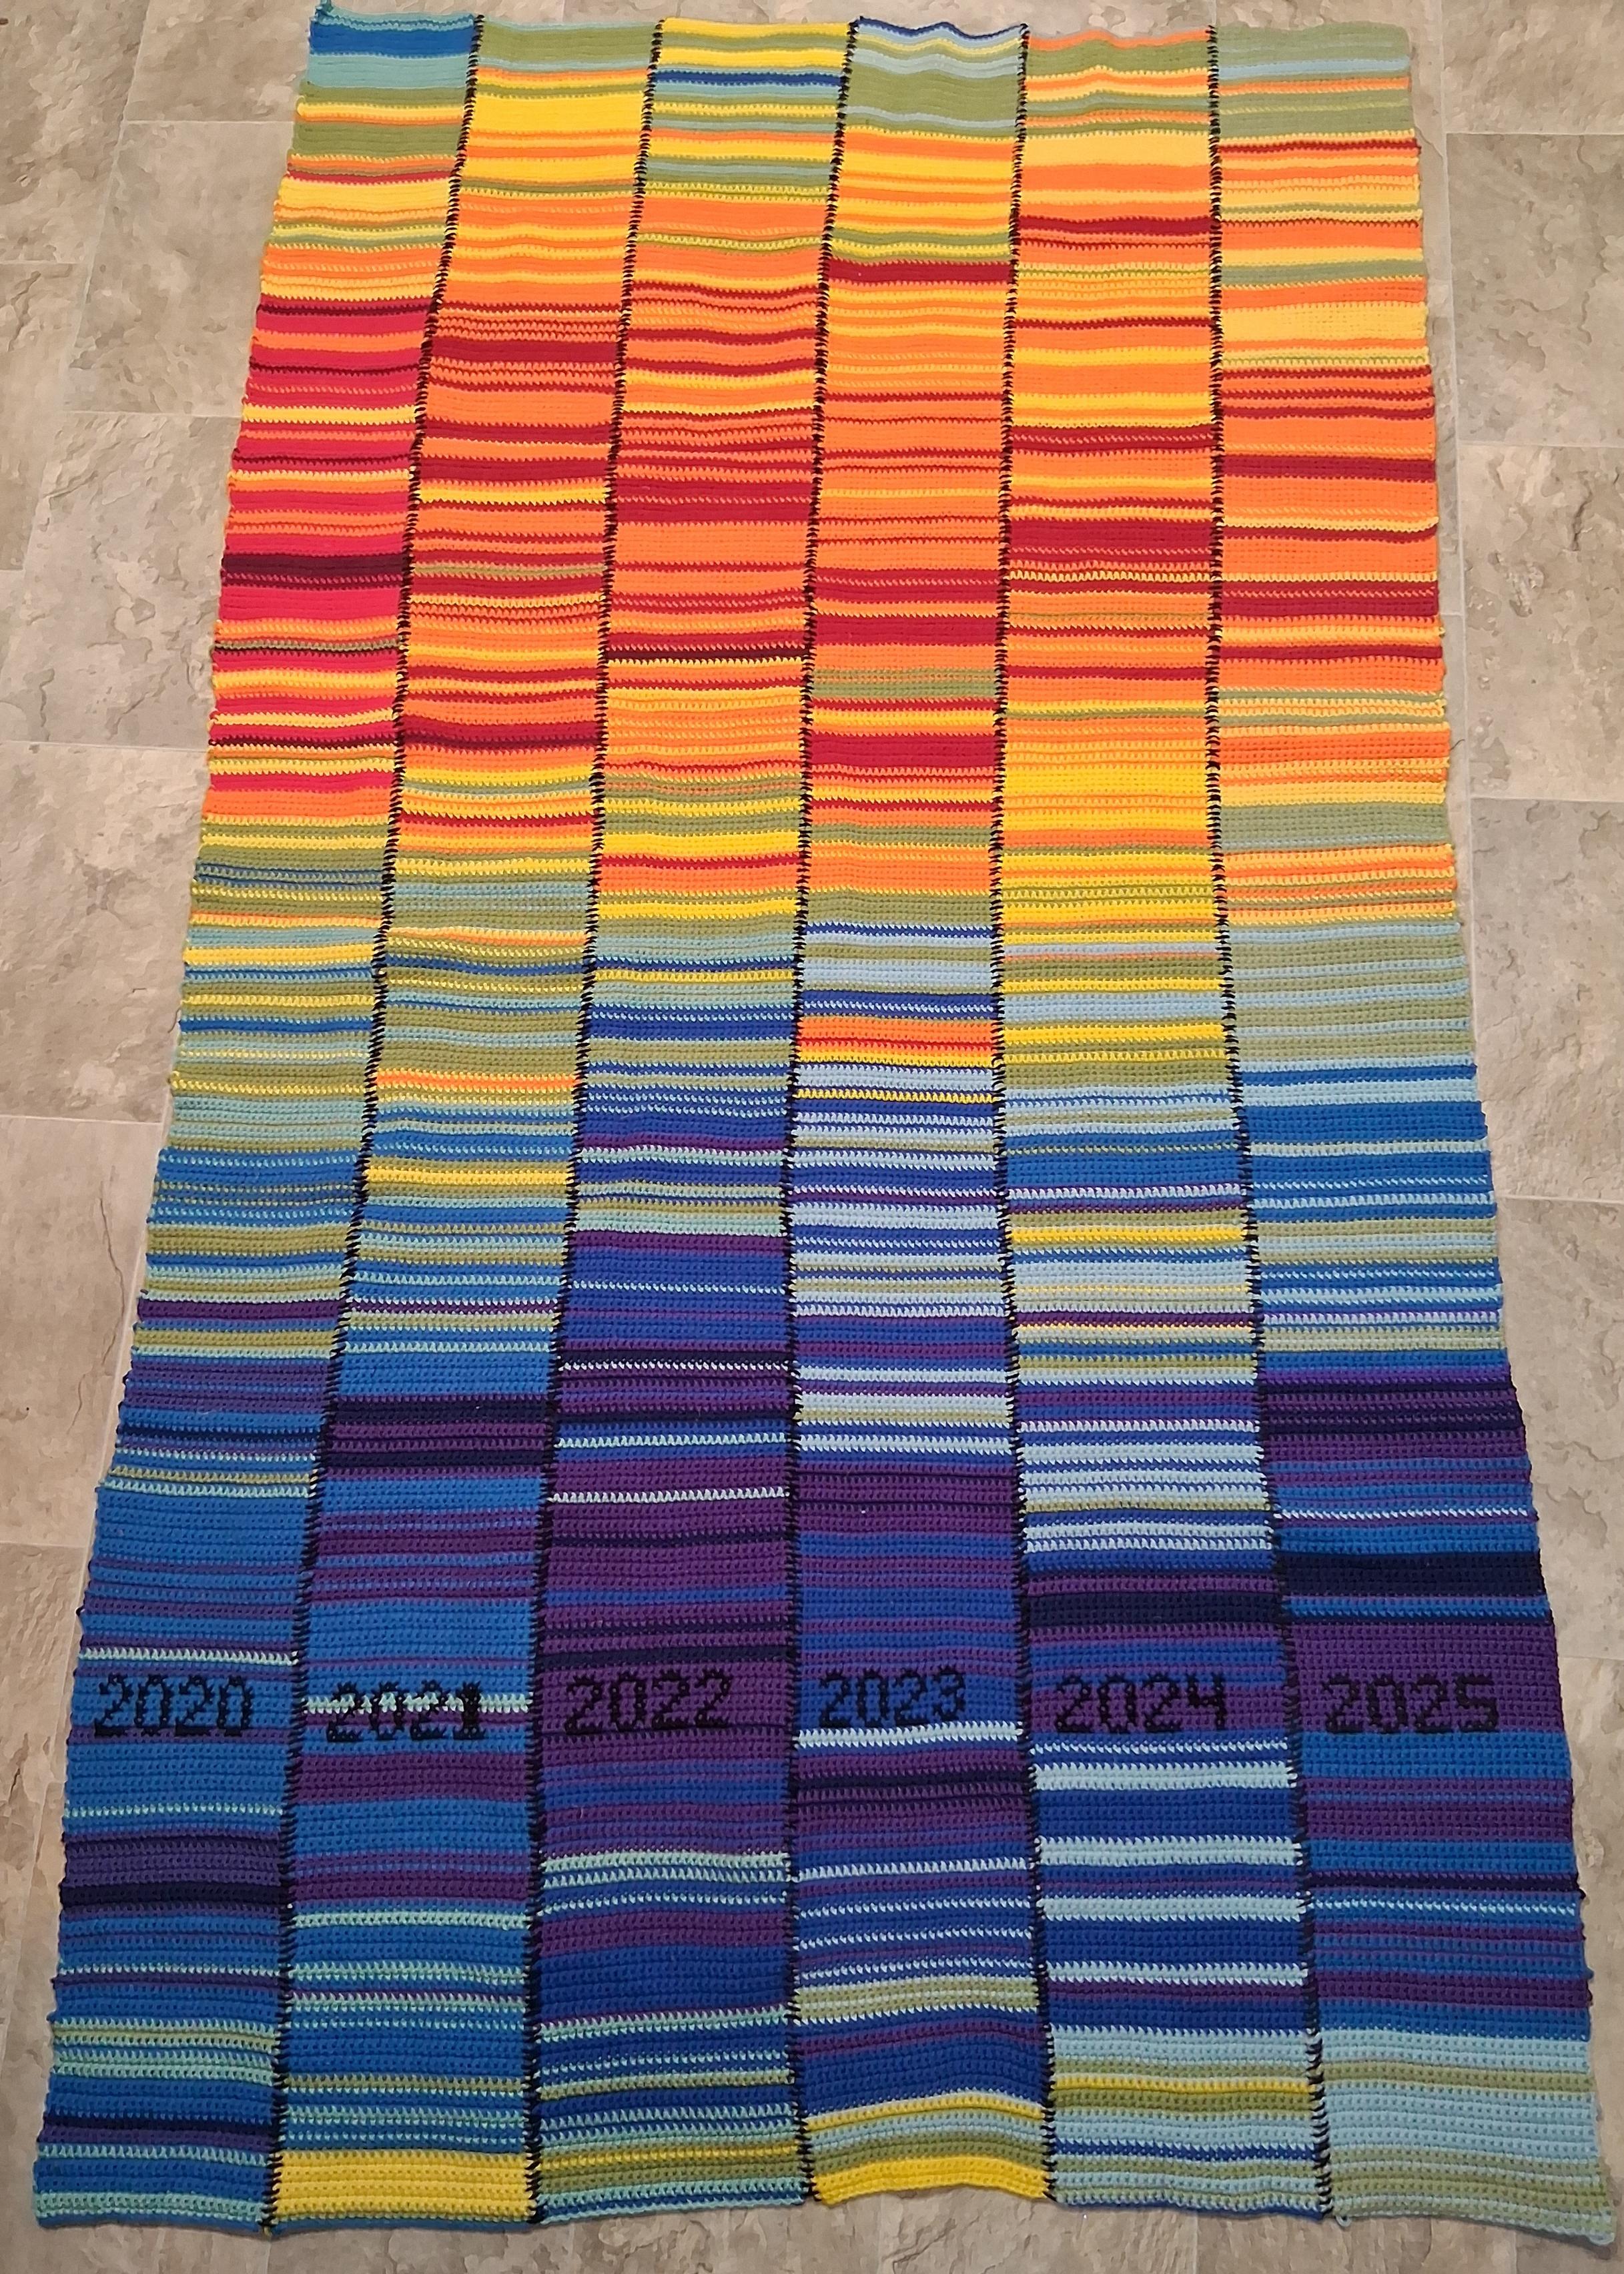
I have finished the temperature blanket panel for 2025! This is a decade-long project. Each stripe represents the local daily high temperature in farenheit: red is 90s, orange is 80s, yellow is 70s, and so on.
To capture the entire winter and summer seasons, the first bottom row actually starts on November 1st of the previous year, and the numbers are placed on January 1st of the labeled year, and it continues up from there.
-
I have finished the temperature blanket panel for 2025! This is a decade-long project. Each stripe represents the local daily high temperature in farenheit: red is 90s, orange is 80s, yellow is 70s, and so on.
To capture the entire winter and summer seasons, the first bottom row actually starts on November 1st of the previous year, and the numbers are placed on January 1st of the labeled year, and it continues up from there.
Beautifully tragic
-
 undefined oblomov@sociale.network shared this topic
Gli ultimi otto messaggi ricevuti dalla Federazione
-
@AlSweigart @mcc I want concealed carry of double-handed swords. Now *that*'s going to be an interesting technical challenge, even if it becomes legal.
-
Things like this are too small to keep track of
-
@cwebber AI wrote this.
-
Come funzionano le "esportazioni della democrazia"?
– Dobbiamo lanciare i missili. Non c'è altra scelta.
– Perché?
– Come perché? C'è un regime oppressivo.
-- È vero, ma a cosa serve il nostro intervento?
– Bisogna impedire al regime di massacrare la gente.
– Come?
– Massacriamola noi.
-
@grickle This might be the best ever.
-
SIM and SD cards are like guitar picks: blink, and they are gone.
-
@cwebber @tante https://www.nbcnews.com/politics/politics-news/poll-majority-voters-say-risks-ai-outweigh-benefits-rcna262196
-
@stefano also #easterEgg